Rust 02. Debugging with rust-analyzer and CodeLLDB
Summary
When you debug Rust in VS Code, one of the easiest stacks to understand is rust-analyzer together with CodeLLDB. This post focuses on the most common beginner path inside a Cargo project: entering debug mode, creating launch.json, setting breakpoints, inspecting variables and the call stack, and passing command-line arguments.
The practical takeaway is: create a Cargo project first, install rust-analyzer, add CodeLLDB, and use launch.json to make the debug conditions reproducible.
Document Information
- Written on: 2026-04-08
- Verification date: 2026-04-15
- Document type: tutorial
- Test environment: Cargo project, VS Code,
rust-analyzer,CodeLLDB, Windows-style example paths - Test version: VS Code,
rust-analyzer, andCodeLLDBversions not fixed - Source quality: only official documentation and the upstream repository are used.
- Note: this post intentionally stays with the
rust-analyzer + CodeLLDBpath because it is one of the easiest debugger stacks for beginners to follow consistently.
Problem Definition
At the beginning, Rust debugging in VS Code usually feels unclear in four places.
- It is not obvious whether debugging should be explained around a single file or a Cargo project.
- The roles of
rust-analyzerandCodeLLDBare easy to mix up. launch.jsonoften feels abstract until it is tied to a real executable path and arguments.- Breakpoints, variables, the call stack, and argument passing do not always feel like one connected workflow.
This post only covers the basic Cargo-project path needed to reduce that confusion. It does not cover WSL, remote containers, multiple binaries, test debugging, or advanced LLDB settings.
How to read this post: separate the layer that helps the editor understand code from the layer that actually stops and inspects a running program. rust-analyzer helps with analysis and debug entry points. CodeLLDB and launch.json define the executable, working directory, and arguments for a reproducible debug session.
Verified Facts
- The official VS Code Rust guide explains the workflow around Cargo projects and
rust-analyzer. Evidence: Rust in Visual Studio Code Meaning: opening a Cargo project gives VS Code andrust-analyzerenough structure to connect editor features with the Rust build flow. - The official VS Code debug configuration guide explains that
.vscode/launch.jsonis where debugger type, executable path, working directory, and arguments are defined. Evidence: Visual Studio Code debug configuration Meaning:launch.jsonis not just a button configuration file. It stores the conditions needed to reproduce a debug run. - The official VS Code debugging guide documents the standard debug keys such as
F5,F9,F10, andF11. Evidence: Debug code with Visual Studio Code Meaning: at the beginner stage, you do not need every debugger feature. Start with break, continue, step over, and step into. rust-analyzeris the main editing and language-analysis layer, whileCodeLLDBis an LLDB-based debugger extension. Evidence: rust-analyzer book, CodeLLDB repository Meaning: if code lenses or diagnostics are missing, inspectrust-analyzerfirst. If breakpoints or launch behavior fail, inspectCodeLLDBand the debug configuration first.
Directly Confirmed Results
1. A Cargo project was the cleanest debugging baseline
- Direct result: the flow below matched the debugger setup much better than a single-file example.
cargo new rust-debug-demo
cd rust-debug-demo
code .
- How to read this: the goal is to let VS Code recognize the Cargo project root. A single-file flow such as
rustc hello.rsworked for compilation, but it was a poor fit for therust-analyzer + CodeLLDBwalkthrough used in this post.
2. Installing rust-analyzer made debug entry much easier
- Direct result: after opening a Cargo project in VS Code and installing
rust-analyzer, aRun | Debugbutton appeared abovefn main().

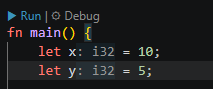
-
Direct result: that button, or the
Rust Analyzer: Debugcommand, was enough to enter the first debug session. -
How to read this: seeing
Run | Debugmeans the editor has connected the current function to the Cargo project. If it does not appear, check that the project root is open and thatrust-analyzeris running.
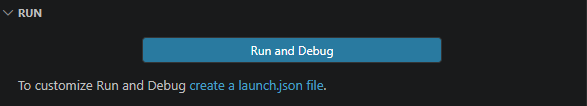
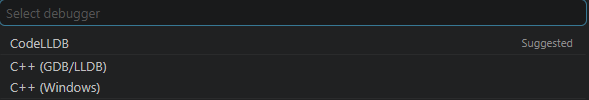
3. CodeLLDB and launch.json fixed the execution conditions
- Direct result: in the Run and Debug view, selecting
create a launch.json fileand then choosingCodeLLDBcreated the basic debug configuration.

- Direct result: the simplest Windows example looked like this.
{
  "version": "0.2.0",
  "configurations": [
    {
      "type": "lldb",
      "request": "launch",
      "name": "CodeLLDB: Rust Debug",
      "program": "${workspaceFolder}/target/debug/${workspaceFolderBasename}.exe",
      "args": ["abcd", "efgh"],
      "cwd": "${workspaceFolder}"
    }
  ]
}
- It was easiest to use after building once with:
cargo build
- How to read this:
programis the executable path,argsare the values passed to the program, andcwdis the working directory. When a debug session fails, these three fields are the first things to inspect.
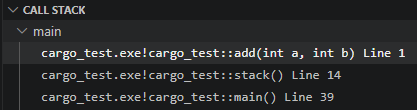
4. Breakpoints, variables, and the call stack were easiest to learn in this order
- Direct result: the four keys below were enough to understand the basic flow.
F9: set a breakpointF5: run or continueF10: step overF11: step into
- Direct result: once a breakpoint was hit, the variables panel and call stack immediately made the current state easier to read.
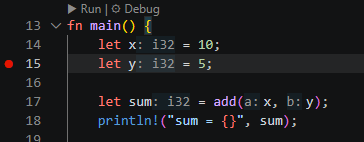
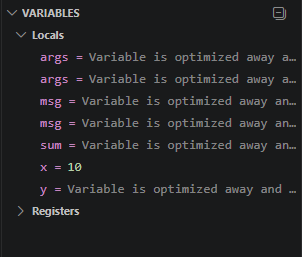
5. Argument-based debugging was reproducible through args
- Direct result: putting the code below into
src/main.rsand configuringargsinlaunch.jsonmade it easy to verify how command-line arguments entered the program.
fn main() {
    let args: Vec<String> = std::env::args().collect();

    if args.len() > 0 {
        println!("args[0] = {}", args[0]);
    }

    if args.len() > 1 {
        println!("args[1] = {}", args[1]);
    } else {
        println!("args[1] is missing.");
    }

    if args.len() > 2 {
        println!("args[2] = {}", args[2]);
    } else {
        println!("args[2] is missing.");
    }
}
- The
launch.jsonsection looked like this.
"args": ["abcd", "efgh"]
- Observed result:
args[0] = <executable path>
args[1] = abcd
args[2] = efgh
- How to read this:
args[0]is not the first option you typed. It usually represents the executable path. The values fromlaunch.jsonappeared starting atargs[1]andargs[2].
Interpretation / Opinion
- Key decision at this stage: for beginners, it is easier to learn one debugger stack consistently than to mix several debugger extensions at once.
rust-analyzer + CodeLLDBis a practical pair for that. - Decision rule: if the target is still a single file, first move it into a Cargo project; if the same debug setup will be repeated, pin it in
launch.json. - Interpretation:
launch.jsonis not just an option file. It is the reproducibility layer that pins down which executable, working directory, and arguments are used during a debug session.
Limits and Exceptions
- This post is written for local Windows VS Code usage. It does not cover macOS, Linux, WSL, Remote SSH, or Dev Container setups.
- Button placement, menu labels, and onboarding text can vary across VS Code,
rust-analyzer, andCodeLLDBversions. - The official VS Code Rust guide sometimes points Windows users to the Microsoft C++ extension first. This post stays with
CodeLLDBto keep the walkthrough on one debugger stack. - Test debugging, attach mode, multiple binaries, and larger workspace setups are outside the scope of this post.
- Remaining questions after this post include test debugging, attach debugging, and remote-environment debugging. Those need separate treatment because the target process and debugger connection change.
댓글남기기